


Real growth curves, real screenshots, real lessons
Every case study is a real engagement with verifiable Google Search Console, Semrush, and Ahrefs data. Here's how to read them and what to look for in the shape of each growth curve.
01.How to read these case studies
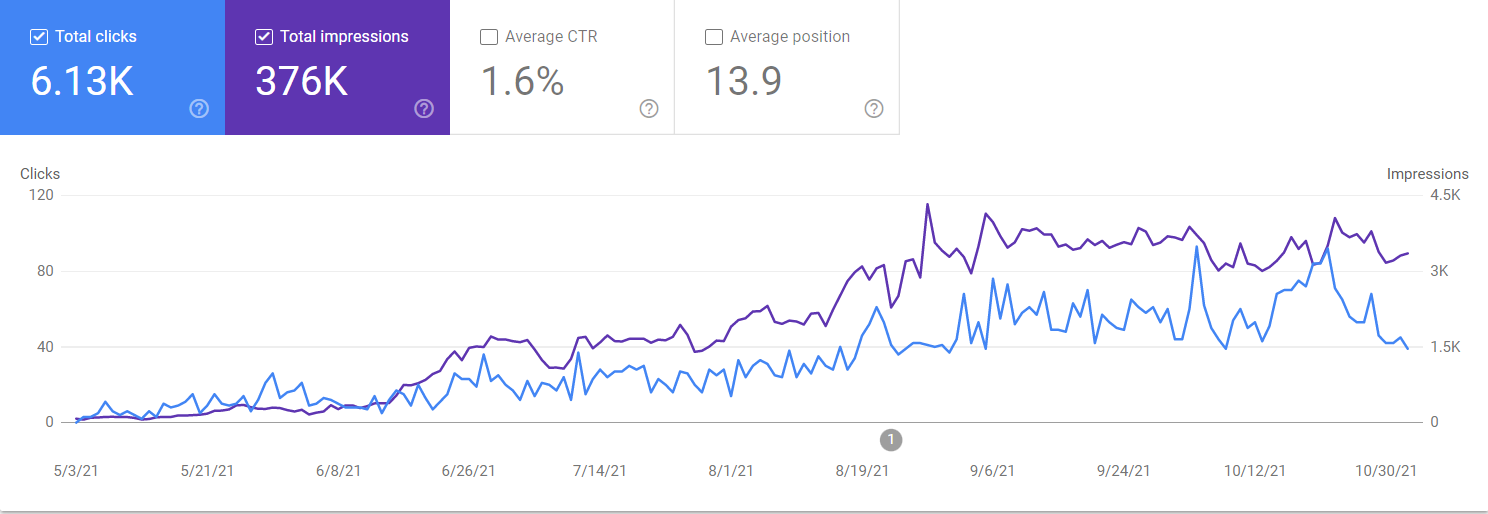
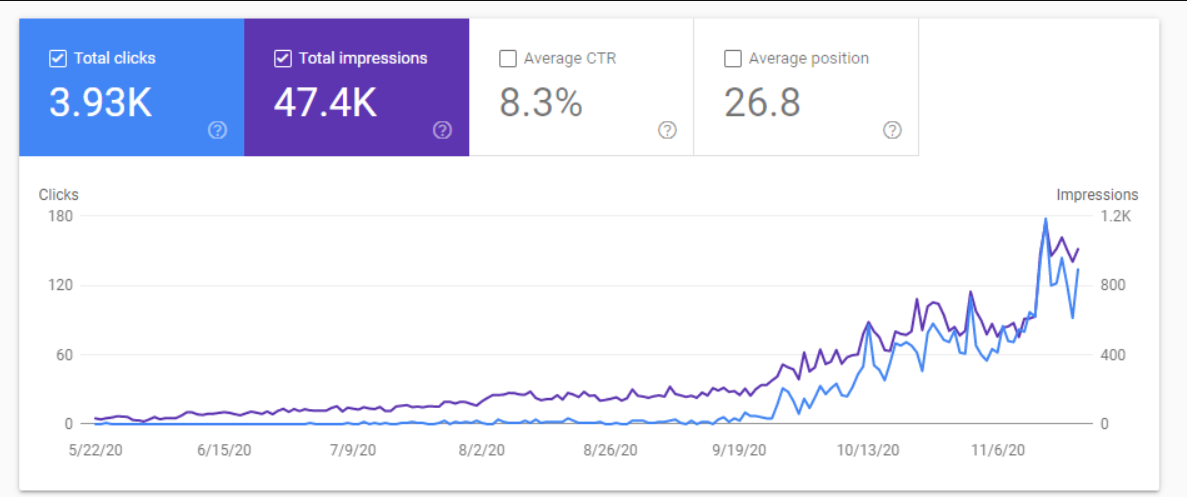
Every case study on this page is a real project, with real Google Search Console screenshots, real Semrush and Ahrefs exports, and real before-and-after metrics. No mocked dashboards, no inflated numbers. The point isn't to brag — it's to show you, concretely, what compounding Local SEO and organic growth looks like over 6–18 months.
Pay attention to the shape of the growth curve, not just the final number. Sustainable SEO almost never goes vertical from week one. What you want to see is a steady upward slope where every month is meaningfully better than the last — that's what happens when the technical foundation, the content engine, and the prominence loop are all running in parallel.
02.Industries and engagement types represented
- Local service businesses — Map Pack ranking, GBP optimisation, geo-grid expansion, inbound call growth.
- Tech media and publishers — full-funnel organic SEO, topic clusters, authority building from zero domain authority.
- Multi-industry website SEO — technical SEO, content optimisation, CTR engineering, position improvements.
- Service-area businesses — coverage across multiple cities and neighbourhoods with a single brand.
03.What these projects have in common
Every case study started with a full audit, a clear strategy, and a written 90-day plan. None of them used black-hat tactics, link farms, or AI-spam content. The wins came from disciplined fundamentals executed weekly: keyword and intent mapping, on-page and technical SEO, schema, content depth, prominence signals, and patient measurement.